Employee Benefits
The ROI of feeding your team: a numbers guide for HR
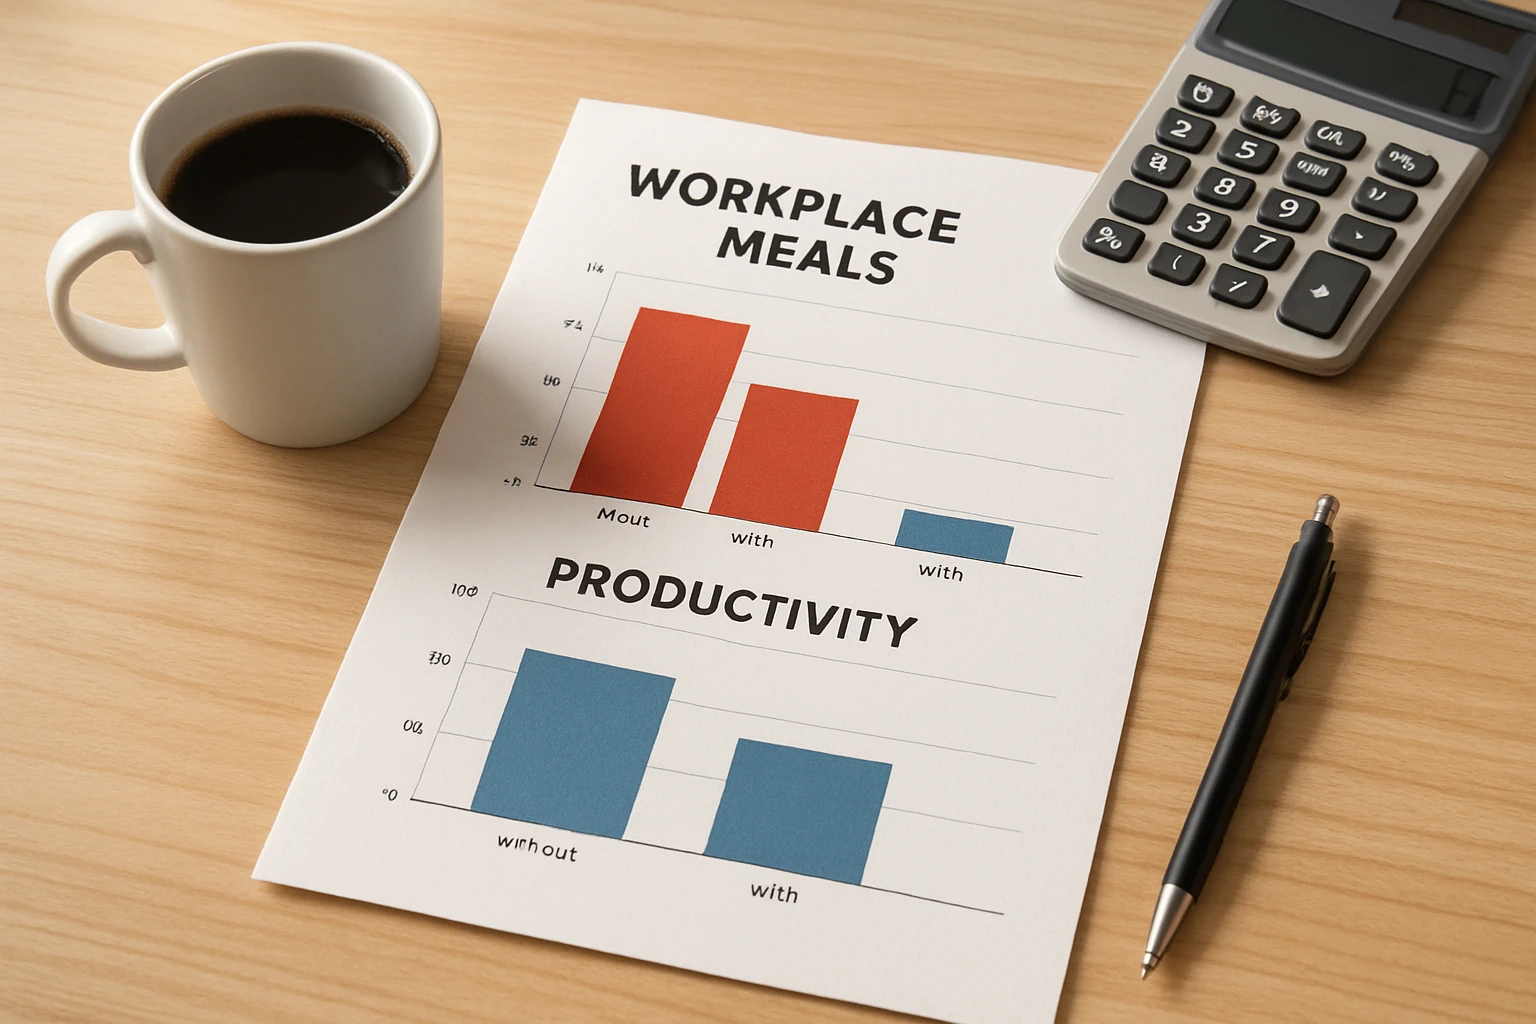
When HR brings a food program proposal to finance, the conversation usually goes one of two ways. Either the finance team says yes because they trust the strategic judgment of the HR team and the cost is modest, or they ask for a number. This post is for the second scenario.
The ROI case for feeding your team is real and can be modeled. It is not precise in the way that a software licensing renewal is precise, there are variables that depend on your specific workforce, your current turnover rate, and how well you execute the program. But it is directionally clear and the math is not difficult. Here is how to build the case.
There are three primary channels through which a workplace food program generates measurable financial return: turnover reduction, productivity improvement, and absenteeism reduction. Each has a reasonably established evidence base and can be translated into dollar estimates for your specific workforce.
This is typically the largest single input and the easiest to quantify. The formula is:
(Annual separations) × (Per-replacement cost) × (Estimated turnover reduction rate)
SHRM's research places per-replacement cost at $3,000 to $5,000 for hourly workers and $10,000 to $15,000 or more for salaried employees. These figures include direct costs (recruiting, onboarding, training) and indirect costs (productivity gap during the ramp-up period, overtime paid to cover vacancies, supervisor time spent managing the hiring process).
For the turnover reduction rate, research on food benefits suggests a 5 to 15 percent relative reduction in voluntary departures when a consistent, quality food program is introduced. A 10 percent relative reduction is a reasonable conservative estimate for planning purposes.
Example: A 200-person warehouse operation with 45 percent annual turnover and a $4,000 per-replacement cost has 90 annual separations at a total replacement cost of $360,000. A 10 percent relative reduction in voluntary turnover (9 fewer departures) saves $36,000 per year. A 15 percent reduction saves $54,000.
The afternoon productivity slump is one of the most well-documented phenomena in occupational health research. It is not simply tiredness. It is a measurable degradation in cognitive function, reaction time, and sustained attention that occurs when blood glucose drops after an inadequate midday meal (or no meal at all). Research published in the Harvard Business Review and in peer-reviewed occupational health journals has documented that poorly nourished workers lose one to two hours of effective output per day compared to well-nourished colleagues doing identical work.
For knowledge workers, the productivity loss is concentrated in decision quality and error rates. For manual workers, warehouse pickers, manufacturing line workers, clinical staff. It shows up in slowed pace, increased error rates, and elevated injury risk in the final hours of a shift.
The formula:
(Number of workers) × (Hourly wage) × (Estimated hours of productivity recovered per day) × (Working days per year)
Example: 150 workers at $20/hour. Recovering even 0.5 hours of effective output per day per worker (a conservative estimate) yields: 150 × $20 × 0.5 × 250 = $375,000 in recovered productivity value annually. Even discounted heavily for execution uncertainty, this is a significant number relative to a food program cost.
Note that this input is harder to isolate and attribute than turnover savings, which is why it is often excluded from formal CFO presentations. But it is real, and for operations where throughput and quality rates are closely tracked, before-and-after comparison is possible.
The Centers for Disease Control and Prevention (CDC) has documented the connection between poor nutrition, chronic health conditions, and workplace absenteeism. Workers with poor dietary habits are at elevated risk for cardiovascular disease, type 2 diabetes, and metabolic syndrome, conditions that, once established, generate significant absenteeism through sick days, medical appointments, and complications. Poor in-shift nutrition also contributes directly to same-day impairment: workers who are hypoglycemic or severely fatigued from poor eating are more likely to call in sick or leave early.
The absenteeism formula:
(Expected absenteeism reduction in days per worker per year) × (Number of workers) × (Daily wage + cost of coverage/overtime)
The CDC estimates that poor employee health costs U.S. employers an average of $1,685 per employee per year in productivity losses and absenteeism. A food program will not capture all of this, many contributing factors are outside an employer's control. But a reduction of one or two sick days per employee per year attributable to better nutrition is within the plausible range of the research, and for a workforce of any size, that translates into real savings.
Here is a combined model for a hypothetical 150-person Southern California manufacturing employer with a 35 percent annual hourly turnover rate:
For a higher-turnover environment (45%+) or larger workforce, the turnover savings component alone often covers the program cost.
The model above intentionally sticks to what can be reasonably estimated. But there are real returns that don't fit neatly into a spreadsheet:
Recruiting edge: In competitive labor markets, which describe most of SoCal's employing industries, a food benefit generates differentiation in job postings and conversations. Candidates who compare two similar offers and find that one includes on-site meals weigh that more heavily than almost any comparable-dollar benefit. This reduces time-to-fill and, over time, improves applicant quality.
Culture signal: An employer who feeds their team is communicating something about how they view the employment relationship. This is not measurable in a spreadsheet, but it affects discretionary effort, peer referrals, and the organizational behaviors that show up in engagement surveys. Gallup has documented that highly engaged workforces are 17 percent more productive than disengaged ones, a number that dwarfs the food program cost at any reasonable workforce size.
Return-to-office compliance: For employers managing hybrid-to-in-office transitions, on-site food benefits are one of the most consistently cited inducements that move the needle. If a food program facilitates even a modest increase in in-office days, the return in collaboration, onboarding effectiveness, and culture coherence can be substantial.
For a detailed guide on how to structure this argument for a CFO audience, see our post on how to write a workplace food program proposal for your CFO. For the retention-specific data, see do meal benefits reduce turnover? and our post on employee meal benefits that actually boost retention. To get started with a program, contact us for a worksite-specific assessment and quote.
The cleanest approach is to build it from components: what does your recruiting team or agency cost per hire (either fee-based or time-cost of internal recruiting), plus your average onboarding cost (training hours × trainer wage), plus an estimate of the productivity ramp-up period (new hire at 50% productivity for their first 30 to 60 days × their wage). SHRM's $3,000–$5,000 range for hourly workers is a reasonable benchmark if you haven't done this calculation, but your actual number may be higher in tight labor markets or for specialized roles. Using a conservative number in the presentation is strategically wise. It makes the case without requiring you to defend aggressive assumptions.
The honest answer is that productivity improvement is the hardest input to attribute with precision, and you should present it accordingly. What you can do: cite the underlying research (Harvard Business Review research on food and cognitive performance, NIOSH data on workplace nutrition and output), apply a large discount factor to the theoretical value, and frame it as "additional upside not captured in the primary model" rather than a primary input. Finance teams respond well to HR teams that are intellectually honest about what they can and cannot prove, presenting a conservative model that holds up under scrutiny is more effective than presenting an aggressive model that creates skepticism.
This depends significantly on the format and subsidy level. A fully employee-paid smart fridge, where the employer covers only installation and a modest placement cost, has a negligible direct cost to the employer, the per-unit cost may be zero or a small flat monthly fee. A subsidized daily lunch program where the employer covers $3 to $6 per meal per employee, runs $750 to $1,500 per employee per year at five days per week. A partial subsidy (covering $2 per meal) reduces that to $500 per employee per year. For the ROI model, the comparison to per-replacement cost is usually favorable even at full subsidy. But the program design should reflect what your budget and program goals actually require.
Including it directionally, with transparent assumptions, can strengthen the case. In SoCal labor markets, a food benefit is a differentiator that is likely to reduce time-to-fill for open roles. If you know your average cost-per-hire (including time value of internal recruiting) and can estimate a 5 to 10 percent reduction in time-to-fill attributable to improved offer competitiveness, the dollar value is calculable. Whether to include it in a formal CFO presentation depends on your relationship with finance and how conservative you want to be. Many HR teams present it as a separate line with a note that it's an estimate, which is accurate and intellectually honest.
Yes, but the math looks different. For a 50-person employer, the turnover savings are smaller in absolute terms, but the program cost is also lower (fewer meals, smaller subsidy spend). The productivity improvement and absenteeism reduction benefits scale proportionally. Where the ROI is most compelling for smaller employers is in industries with high replacement costs for specialized roles, healthcare, technical manufacturing, skilled trades where even a small number of avoided separations generates return that covers the program cost. For smaller teams where cost is a concern, MHP's smart fridge model (employee-paid, minimal employer cost) or a weekly team meal delivery program (one or two days per week rather than daily) provides a meaningful benefit with limited budget impact.
Tell us about your team and we will recommend the right program and a worksite-specific quote. No high-pressure sales.
Hot buffet lunches, a 24/7 smart fridge, or weekly meal drops — cooked in our Rancho Cucamonga kitchen and run as one simple program.